Different people mean different things, when they talk about observability. To stay practical and concrete, by observability I mean monitoring, tracing and logging. In this post I will give recipe of adding monitoring to your Spring Boot service with Prometheus and Grafana.
TL;DR If you prefer reading code vs reading posts — just follow this link.
1. What will we build?
I will follow simple plan:
Setup vanilla Spring Boot service (straight from https://start.spring.io)
Setup Prometheus
Setup Grafana
Perform some basic load testing and observe results
So, let’s start.
2. Bootstrapping Spring Boot service
$ curl https://start.spring.io/starter.zip \
-d dependencies=actuator,webflux,lombok \
-d type=maven-project \
-d baseDir=service \
-d groupId=com.oxymorus.monitoring \
-d artifactId=service \
-d bootVersion=2.1.9.RELEASE \
-o service.zip

$ unzip service.zip && rm service.zip && cd service
After bootstrapping bare-bones service, let’s prepare next steps by creating monitoring directory. This will be our base directory, where we place scripts and configs for Prometheus and Grafana:
$ mkdir monitoring && cd monitoring3. Setting-up Prometheus
| Prometheus is an open-source systems monitoring and alerting toolkit. |
Spring Boot provides monitoring data in Promethues format through /actuator/prometheus endpoint. So, first, we need to expose this endpoint in application.yml:
management:
  endpoints:
    web:
      exposure:
        include:
          - prometheus
Next, we need to configure scrapping of exposed endpoint by Prometheus. To do this, we provide prometheus.yml:
# my global config
global:
  scrape_interval:     15s # Set the scrape interval to every 15 seconds. Default is every 1 minute.
  evaluation_interval: 15s # Evaluate rules every 15 seconds. The default is every 1 minute.
  # scrape_timeout is set to the global default (10s).

# Load rules once and periodically evaluate them according to the global 'evaluation_interval'.
rule_files:
# - "first_rules.yml"
# - "second_rules.yml"

# A scrape configuration containing exactly one endpoint to scrape:
# Here it's Prometheus itself.
scrape_configs:
  # The job name is added as a label `job=<job_name>` to any timeseries scraped from this config.
  - job_name: 'prometheus'
    # metrics_path defaults to '/metrics'
    # scheme defaults to 'http'.
    static_configs:
      - targets: ['127.0.0.1:9090']

  - job_name: 'spring-actuator'
    metrics_path: '/actuator/prometheus'
    scrape_interval: 5s
    static_configs:
      - targets: ['127.0.0.1:8080']
Finally, we can launch Promethues with Docker using following script:
#!/bin/sh
docker run --net=host -p 9090:9090 \
-v $(pwd)/prometheus.yml:/etc/prometheus/prometheus.yml \
prom/prometheus:v2.2.0
Don’t forget to make script executable with chmod +x prometheus.sh |
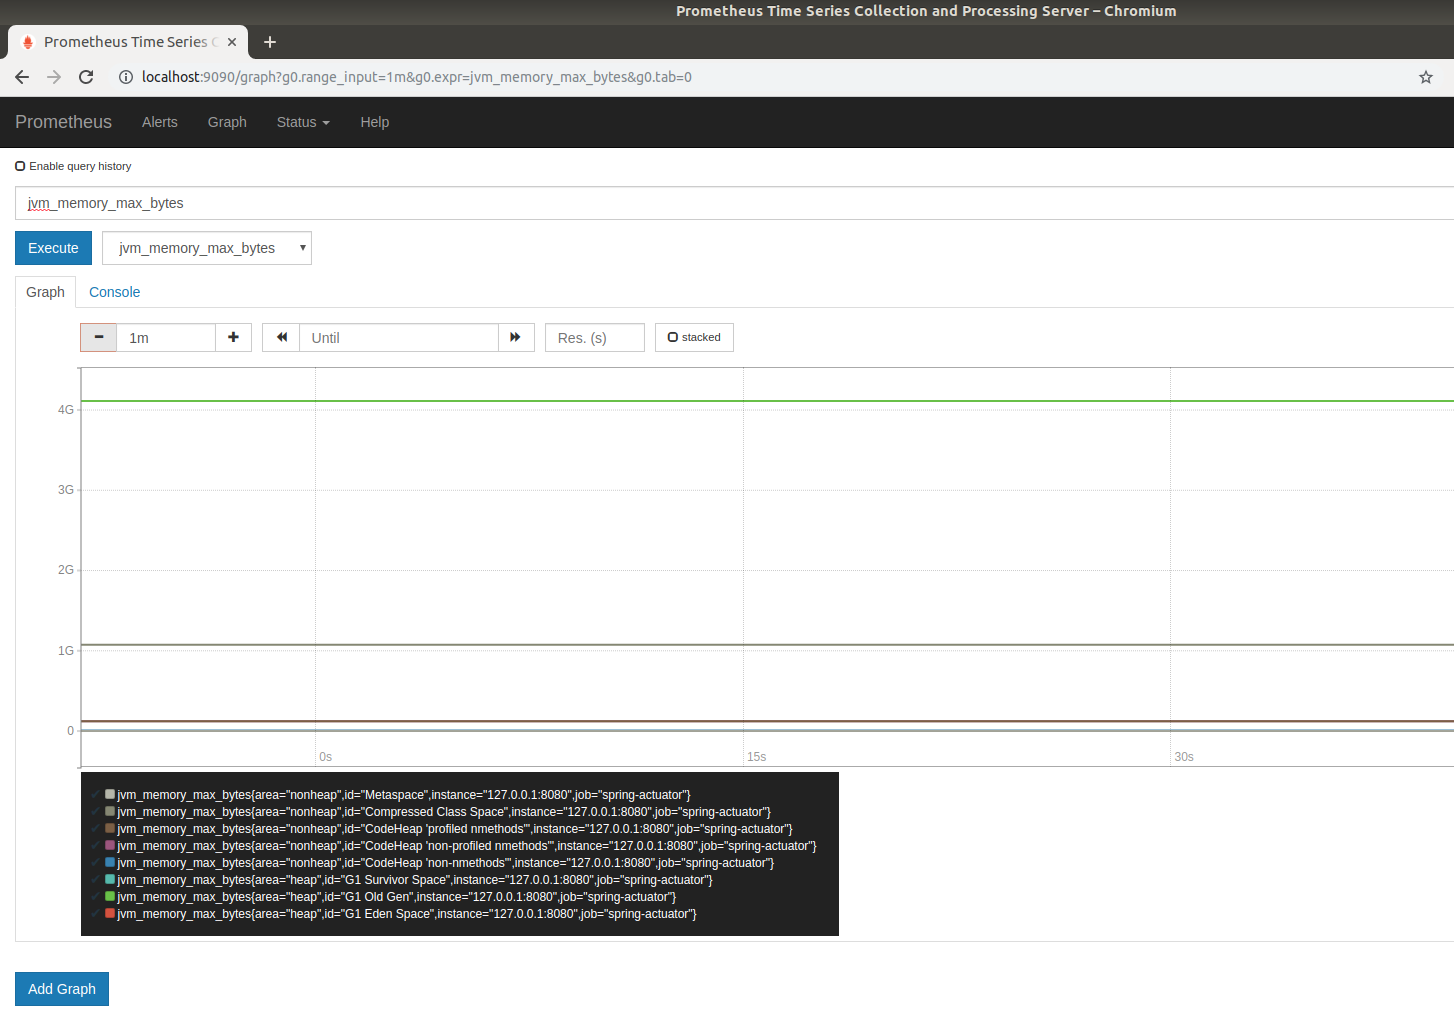
The script starts Prometheus on port 9090 and configures it to scrape Spring Boot /actuator/prometheus endpoint.
We can check that everything is working by visiting default dashboard at localhost:9090:
4. Setting-up Grafana
| Grafana is an open source metric analytics & visualization suite. It is most commonly used for visualizing time series data for infrastructure and application analytics but many use it in other domains including industrial sensors, home automation, weather, and process control. |
Grafana uses dashboards to organize your monitoring/metrics visualisation. So, we will preconfigure several dashboards:
To provision these dashboards we need to provide grafana-dashboard.yml:
apiVersion: 1

providers:
  - name: 'default'
    folder: 'Spring Boot'
    type: file
    options:
      path: /etc/grafana/dashboards
Next, to connect Grafana with Prometheus as its datasource we should provide grafana-datasource.yml:
apiVersion: 1

datasources:
  - name: prometheus
    type: prometheus
    access: direct
    url: http://127.0.0.1:9090
Finally, after all preparation we can start Grafana with following script:
#!/bin/sh
docker run -i --net=host \
-p 3000:3000 \
-v $(pwd)/grafana-datasource.yml:/etc/grafana/provisioning/datasources/grafana-datasource.yml \
-v $(pwd)/dashboards/grafana-dashboard.yml:/etc/grafana/provisioning/dashboards/grafana-dashboard.yml \
-v $(pwd)/dashboards/jvmgc-dashboard.json:/etc/grafana/dashboards/jvmgc.json \
-v $(pwd)/dashboards/latency-dashboard.json:/etc/grafana/dashboards/latency.json \
-v $(pwd)/dashboards/processor-dashboard.json:/etc/grafana/dashboards/processor.json \
grafana/grafana:5.1.0
Don’t forget to make script executable with chmod +x prometheus.sh |
The script starts Grafana on localhost:3000.
| To login use default admin/admin credentials. |
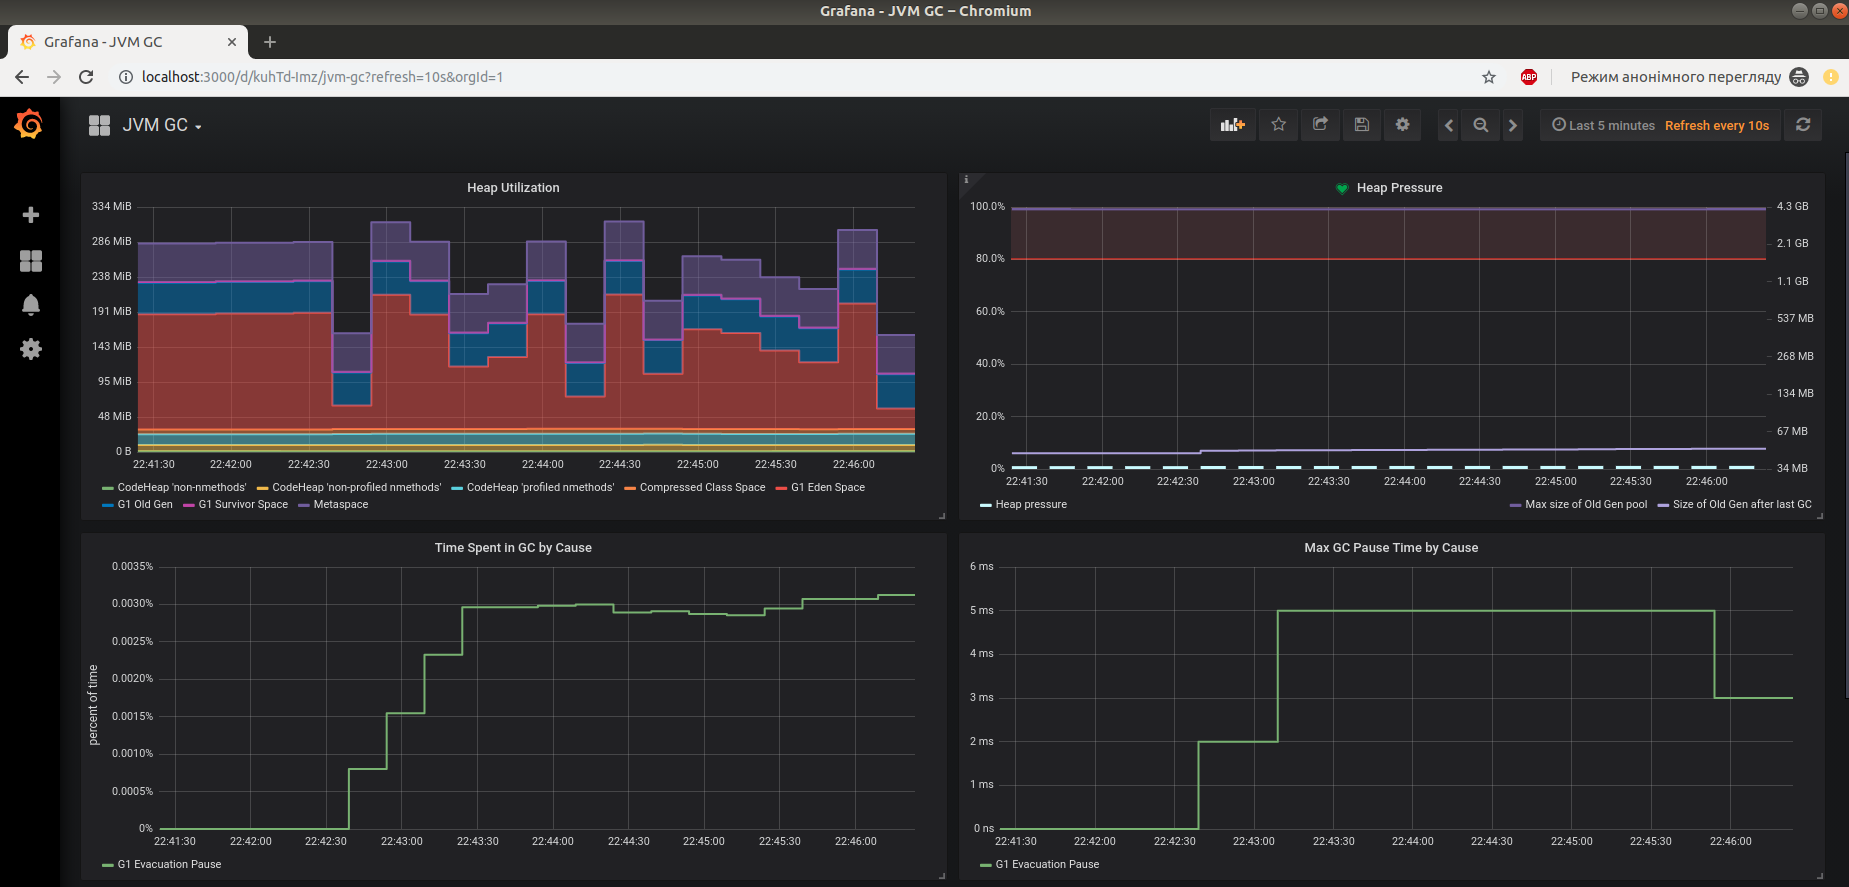
To verify everything is working, check preconfigured JVM GC dashboard:
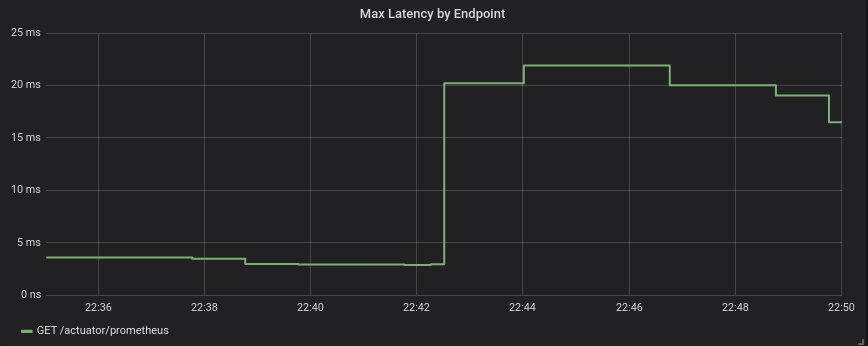
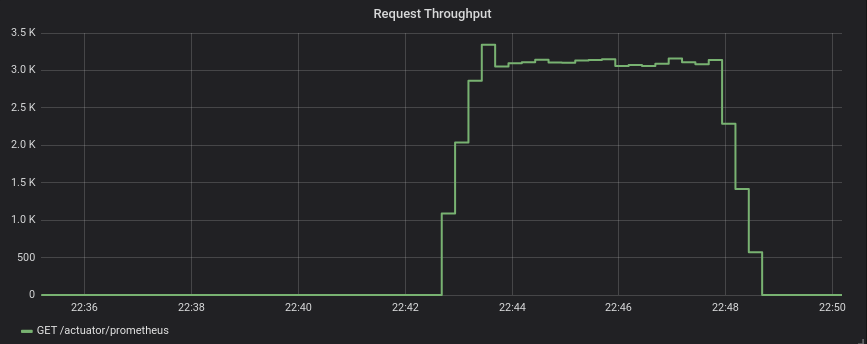
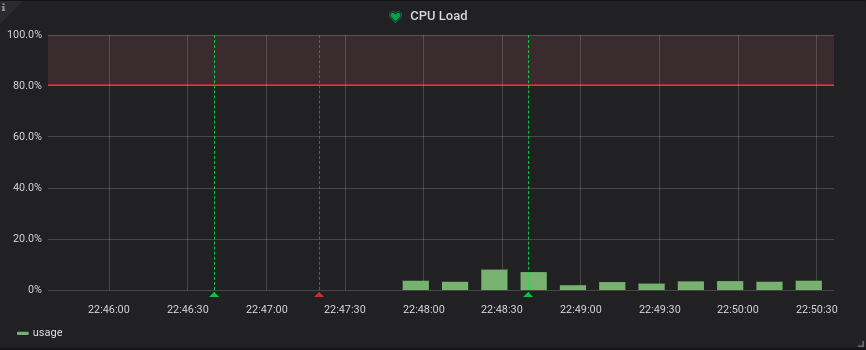
5. Perform some basic load testing and observe results
After service is running and monitoring is properly configured, we can perform some load testing and observe how service behaves.
For load testing we will use simple command line utility Apache Benchmark.
$ ab -n 1000000 -c 10 http://localhost:8080/actuator/prometheusThis command performs 1 million requests in 10 concurrent threads to the http://localhost:8080/actuator/prometheus.
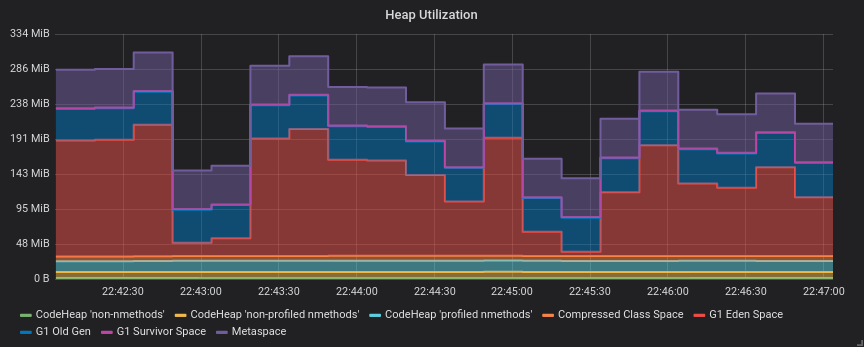
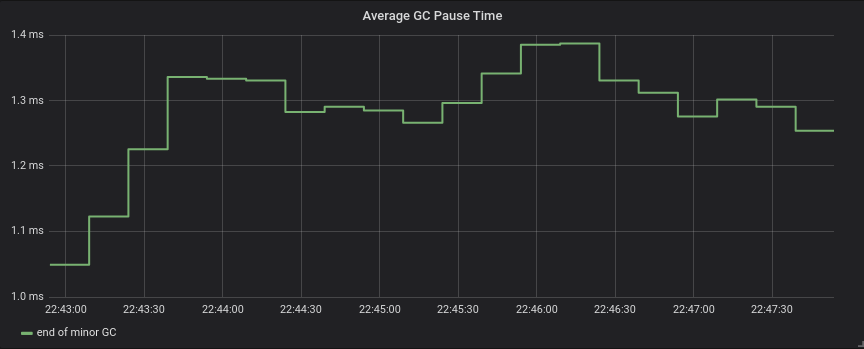
So, it’s time to observe some results:
6. Conclusion
It’s actually straight-forward to setup some basic Prometheus/Grafana monitoring, since all tools are already in place and fit together pretty well.
Available tools allow to get comprehensive view of the system.
Next step, after having this harness in place, is to configure custom metrics with Micrometer and make sense from all of them. I’m saving it for the next time, so stay tuned!
You may also like

Trick Of The Day: Copy DB dump from one Docker container to another
How to copy MySQL dump from one Docker container to another ?
Tool Of The Day: kafkacat
Handy tool for quick producing/consuming Kafka messages and more.
JShell: Awesome Java REPL
In this post I provide a tutorial on using awesome jshell tool.